
You are here
Science
Capitalism has warped our understanding of ecology and life’s origins
The late Ian Watson's sci-fi The Embedding is intriguing – but dated
Unsettling dance piece explores how AI is warping human relationships
A Natural Chemistry Laboratory in Protostar Shock Waves
Complex organic molecules (COMS) are at the heart of life. They're created where jets from protostars slam into the interstellar medium, environments that scientists call natural laboratories. In these intense environments, important carbon-bearing molecules are created. Recent research took a close look at one of these jets and found some COMS in them for the first time.
A New Model Helps Astronomers Study How Merging Black Holes Ring
A new statistical model reveals more details about the ringdown period of merging black holes.
Here are the tree frogs!
Did you spot all three California tree frogs in this morning’s photo? Here’s the “reveal” shot, with the three amphibians circled by Robert Lang:
Rick Beato’s top 40 albums of all time: my take
I simply can’t bear to write anything about war or Trump today, though doubtlessly something related will pop up when I write the news for tomorrow’s Hili post. But until then I want to keep it lighthearted. The Great Duck Egress still weighs heavy on me.
It’s sad that I discovered Rick Beato so late in my life, as I generally share his taste in music, though I remain largely stuck in music of the Sixties through the early Seventies, while he’s much more open to newer music. However, his education and ear make him a great educator, and since I’ve watched his videos I’ve become a lot more attentive in listening to music, especially in understanding what makes my favorite songs my favorite songs. His analyses of “what makes this song great” are my favorites.
In this video Beato lists what he sees at the top 40 “greatest sounding albums of all time,” and by that he means that all the songs on the album are good—but not only good but that sound good. In other words, I think he’s choosing albums that show musicality throughout—that stimulate both the ear and the emotions.
I confess that I don’t know about a third of the albums he mentions, and I don’t share his opinion about many of the ones I do know. Below I’ve put the 12 albums that I have heard and which I think deserve consideration for the list. But many better albums are missing. For example, he gives the Beatles’ “Revolver” an honorable mention, but wouldn’t any of the Beatles albums after “Rubber Soul” be better music than Sufjean Stevens or Seal, good as they are? Apparently Mr Beato wants a variety of artists.
Note that the albums I list are not identical to the songs that Beato plays to exemplify the album, but, as he says, “Any of the songs from these albums are phenomenally great songs.” I am not sure I agree, though I do agree that his exemplar songs are great.
I list below the albums that I both know of and agree are excellent albums, but I would not say they belong on a list of best-sounding albums. Where is Dylan’s “Highway 61 Revisited”? And Joni Mitchell’s “Blue” and “For the Roses” are, to me, at least as “musical” as “Court and Spark.” “Aja” is a dubious choice for Steely Dan; I prefer “Can’t Buy a Thrill” or especially “Katy Lied.” But of course if you included the Beatles or others of that quality, the list would be heavily weighted with just a few artists.
My opinions are of course subjective, and everyone will see omissions on Beato’s list, or inclusions that don’t merit mention. That said, here is where I agree with Beato: these albnums are great as wholes—but not the best albums of all time, not by a long shot.
#35: Bonnie Raitt, “Luck of the Draw”
#32: Tears for Fears, “Song from the Big Chair”.
#29 Sufjean Stevens, “Jacksonville”
#28 Sarah McLaughlin, “Fumbling towards Ecstasy”
#27 Chicago, “Greatest Hits”
#16 The Rolling Stones, “Let it Bleed”
#9 Seal, Seal
Here’s where I started agreeing more with Beato:
#6 The Beach Boys,”Pet Sounds”
#4 Steely Dan, “Aja”
#3 Stevie Wonder “Songs in the Key of Life”
#2 Joni Mitchell, “Court and Spark”
#1 John Coltrane, Jonny Hartman “John Coltane and Johnny Hartman”, which Beato describes as “Probably the most beautifully recorded record ever. “
Honorable Mention (there are several): one is the Beatles “Revolver”
I was delighted to see Coltrane and Hartman nab the top spot, and it’s one of my favorite jazz albums. To me, it is the greatest jazz album of modern times (by that I mean albums released after 1955). But Coltrane/Hartman is jazz, not rock, pop, or folk like the others, and I’m not sure why Beato put it on the list. If you’re going to include jazz in the list of all-time best albums, well, you’re playing a whole new ballgame.
The entire Coltrane/Hartman album in its original incarnation is on YouTube, and I’ve put it below so you can have the pleasure of listening to it. It’s only 31 minutes long, so you have time to hear it today. It’s the album I would give people who weren’t familiar with jazz to ease them into the genre, and I gave it to several women I fancied as a nuptial gift: the musical equivalent of a spider proffering to his swain a silk-wrapped fly.
Anyway, here’s Beato’s list. Don’t confuse his exemplar songs with the quality of the album itself; Beato is touting the album but selling it with a snippet of one of its songs.
Here’s the entire Coltrane/Hartman album. Coltrane is at his best, not too out there to put off newbies, but soft and ballad-y. Most of all his renditions blend perfectly with the smoky voice of Johnny Hartman, an underrated singer. (Hartman died at 60 of lung cancer, and I’m sure his voice reflected many cigarettes.)
Embryos made without sperm or eggs reveal why many pregnancies fail
Why the Second Full Moon of May is a ‘Blue Minimoon’
There’s nothing like a random celestial coincidence, turned good internet meme. In this case, the chance event is this weekend’s Full Moon, which also happens to be the second Full Moon of May, and is also the most distant and visually smallest Full Moon of the year.
Wealthy people with environmental ideals are the biggest emitters
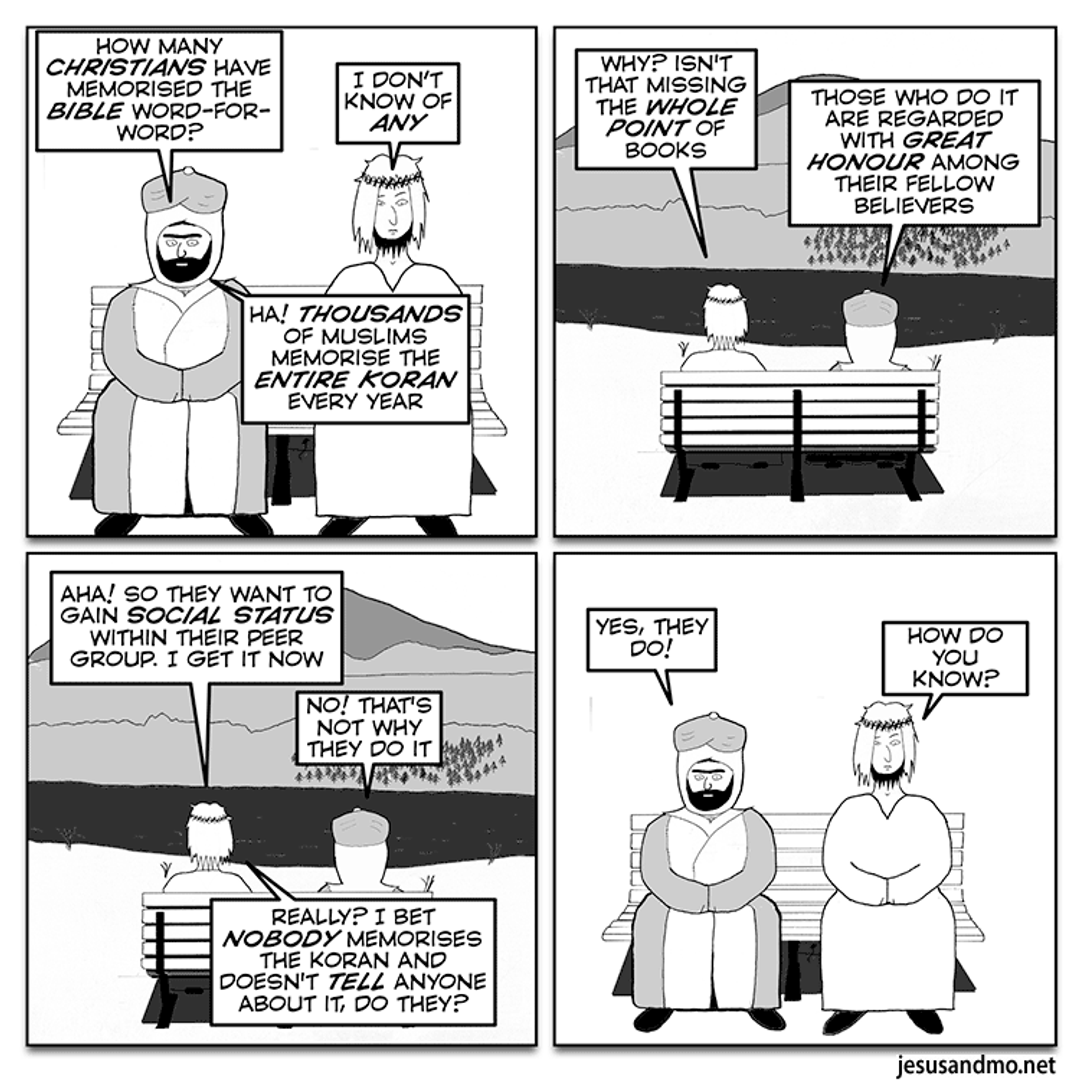
Jesus ‘n’ Mo ‘n’ Hafiz
In today’s Jesus and Mo strip, called “peer”, Mo asserts that many Muslims have memorized the Qur’an word for word. The belief that the book is literally true is ubiquitous among Muslims; one poll by Pew showed this:
Only Muslims in sub-Saharan Africa were asked whether they view the Quran as the word of God or a book written by men; across most of the African nations polled, nine-in-ten or more Muslims say that the Quran is the word of God, including more than seven-in-ten who believe it should be taken literally, word for word.
But how many Muslims have memorized the entire word of God? Mo implies many, but Jesus calls to his attention that there’s confirmation bias.
The strip came with a short note saying, “It’s called Hifaz,” which is the name for the practice of memorizing the whole Qur’an And indeed, there are sites that will, for a fee, help you memorize the entire book.
Scientists break 30-year superconductivity record at normal pressure
Readers’ wildlife photos
Today we have some intertidal photos taken in California by UC Davis math professor Abby Thompson. Abby’s captions and IDs are indented, and you can enlarge her photos by clicking on them.
May is a great month on the California coast, with extreme high and low tides. Here are some photos from the most recent, excellent, set:
Pollicipes polymerus (Gooseneck barnacles). I’ve shown these, and some relatives, several times before, but they’re amazing animals. In case you think it’s too many barnacles, Darwin spent eight years looking at barnacles. “Originally planning a brief month-long study to establish his credentials in invertebrate zoology, he became deeply immersed and cataloged every known living and fossil species.” (Google AI). I’m not sure what the green is doing here, presumably just growing on top of the animals. Some relatives of the nudibranchs stay green from what they eat, and retain bits with the ability to photosynthesize, most famously the adorable leaf sheep:.
Dendronotus venustus (nudibranch):
Paciocinebrina lurida (a snail):
Tonicella lokii (flame-lined chiton):
Genus Tegula (maybe) (another snail). There was a hermit crab living in the shell- I didn’t get a good photo of him. I’m not sure the genus is correct, but the shell was so pretty I wanted to post it:
Nucella ostrina (Northern striped dogwinkle). About the common name—well, it has stripes. And it’s a “winkle” (a word you have to love), or “little whelk”. The dog part, I dunno. They’re very common, and voracious. Some species of Nucella (not sure about this one) can be used to make a deep purple dye, which used to be hard to come by. There’s a fun account of making the dye here, although I’m afraid many snails must have been sacrificed in the process:
Paradialychone ecaudata (worm):
Limpet, probably Lottia pelta (shield limpet). The little lacy edge is tentacles: “Pallial tentacles are tiny, sensory structures lining the mantle margin (pallium) of limpets. . . The tips and shafts of these tentacles are covered in dense tufts of non-motile cilia, which act as sensory receptors.” (Google AI):
Seagulls at sunset:
As always, thanks to experts on inaturalist for help with some IDs. Camera is an Olympus TG-7.
NASA plans a base on the moon spanning hundreds of square kilometres
Injectable Peptides – The New Snake Oil
We are going backwards. Hopefully this will be temporary trend, but it has been consistent for the past few decades. Prior to the FDA we had the “wild west” of patent medicines – anyone could put anything in a bottle and sell it with any claims. It was up to the average person to decide if a product was safe or effective. […]
The post Injectable Peptides – The New Snake Oil first appeared on Science-Based Medicine.Spot the tree frogs!
It’s been a long time since we’ve had a “spot the. . . ” challenge, but Robert Lang submitted one. His caption, indented below, tells you that there are three frogs in the photo. Can you spot them all? There will be a reveal at 11:30 a.m. Robert wrote this:
It’s been a while since you’ve had a “Spot the…” photo, and I think this one qualifies. Here we’re looking for California Tree Frogs (Pseudacris cadaverina). The first one is obvious. The challenge is to spot the other two (total of three). This was taken in the Arroyo Seco in Southern California, on the way up the creek bed to Royal Falls.
Of course you must click the photo to enlarge it for starting your search. PLEASE DO NOT GIVE THE ANSWER IN THE COMMENTS so that everyone can have a go without pointers.