
You are here
News Feeds
Virtual reality could be gamechanger in police-civilian crisis encounters
Dementia risk prediction: Zero-minute assessment at less than a dollar cost
Researchers use artificial intelligence to diagnose depression
A bioinspired capsule can pump drugs directly into the walls of the GI tract
New approach to breakdown PFAS, 'forever' chemicals
Real-world chemists are more diverse than generative AI images suggest
Real-world chemists are more diverse than generative AI images suggest
AI simulations of 1000 people accurately replicate their behaviour
Jesus ‘n’ Mo ‘n’ bias
Today’s Jesus and Mo strip, called “bias,” came with a list of previous strips on the topic (below the cartoon). As usual in this strip, they decry the very behaviors they’re exhibiting.
The note:
It IS weird that they write so may songs about cognitive biases, isn’t it?
deal
outrage
harbour
gaslight
hymn
fallacy
unwary
blackmail
affect
written
told
spiral
fired
Planet 10 times the size of Earth is one of the youngest ever found
IBM entangled two quantum chips to work together for the first time
Google DeepMind AI can expertly fix errors in quantum computers
Extreme heat is now making cities unlivable. How can we survive it?
Ideological activism in my department
Last spring, during all the protests, sit-ins, and encampments at my University—nearly all of them by students favoring Palestine vis-á-vis the war—the protestors decided to bring their beefs into my department. In fact, some of the protestors, given their actions, were probably members of our department (Ecology and Evolution) or undergraduate students , as putting up posters and flyers put requires a university ID card to get into the building, some of the actions were surely done in the evening, when you have to request special access to the building and have a good reason for it, and, tellingly, one of the flyers used the motif of Honey the Duck—my duck. I am showing here just a small selection of flyers and posters that went up last spring.
It hardly requires mention that this kind of ideological propaganda, spread through the department on bulletin boards, white boards, and walls, created a chilling climate. By being posted in “official” places, it gave the imprimatur of the department to an ideological position. Such material is also banned by the University from being affixed to official boards—like the seminar-announcement board below.
But below is one of the anti-Israel posters that appeared in the spring. This one was affixed to the board above, which is supposed to be reserved for seminar announcements and other official department business. At least the poster itself says who created and disseminated it: Students for Justice in Palestine (who else?). But this kind of political propaganda is not supposed to be put on official department boards.
Our department chair, recognizing the inappropriateness of these postings, sent out an email banning them, and he and the staff removed them. Since the beginning of this academic year the protests (save one poster) have not appeared in our department.
Here’s a whiteboard inside one of the buildings used by our department. This kind of drawing is not, I think, against University regulations, but it’s surely inappropriate. Note that it’s a Palestinian flag. Had I drawn an Israeli flag on the board, it would have lasted about an hour! (I do not, of course, parade my political views on department sites.)
The one below was almost certainly made by a member of our department or an undergraduate (I consider grad students as “department members”), and was affixed illegally because all posters must be on bulletin boards and must show the name of the group posting them. Again, Palestinian flags are used in a display of departmental affinity.
Below is the poster that I consider the most odious one. It was placed on several bulletin boards, including the official seminar board shown in the first photo. Not only is it illegally posted, but, to my shock, it used my own special duck, Honey, as an advertisement for “freeing Palestine.”
Now clearly this is aimed at me. To their credit, the office staff, recognizing this, had removed similar posters from the department, hoping I wouldn’t see them. But I did.
My reaction was one of anger, for I loved that duck, and to use her to promote the “freeing of Palestine” (whatever that means) is a direct attack on me for being pro-Israeli. It was, I thought, like using pictures of someone’s pets to promote terrorism.
I suppose the person who put this up, whoever he or she is, calculated that this would intimidate or provoke me. It did not. It only made me more resolute in my desire to support others who favored Israel (particularly the Jewish students), and I did so until the end of the school year.
But it did have an effect that was probably unintended, and which I suppose the posters are happy about. It made me wonder who would do such a thing, especially in a department, where we’re all supposed to be colleagues. Now I’m sure that none of my faculty colleagues would do this, but my guess is that the perp was a graduate student or undergraduate. That is only a guess, of course. But the result is that this poster, combined with the propaganda above, has made me feel alienated from the department, something that I haven’t felt since 1986 when I began my job here, for this has always been a collegial department. Now, when I am in a departmental group like a party or coffee hour, I wonder if someone there could have produced these hateful displays, and so I’ve largely stopped going to these groups.
As I said, this kind of mishigass has largely stopped. And the perpetrators are of course unknown, since they do this work when nobody is around. I’m sure they realize, since they clearly know my proclivities, that I think their moral compass is skewed 180°. But they’ll never give up their anonymity, for they are cowards, like their confrères who wear masks during public demonstrations.
How Scientists Repurposed a Camera on ESA’s Mars Express Mission
A camera aboard the Mars Express orbiter finds a new lease on life.
Sometimes, limitations can lead to innovation. A recent paper highlights how researchers are utilizing the VMC (Visual Monitoring Camera) aboard the European Space Agency’s (ESA) venerable Mars Express orbiter.
The work is a collaboration between the European Space Agency (ESA) and the University of the Basque Country.
A Mars WebcamMars Express is ESA’s first Mars mission. Launched on a Soyuz rocket, Mars Express arrived in orbit around the Red Planet on Christmas Day 2003. The VMC was designed for one primary purpose: to monitor the departure of the ill-fated Beagle 2 lander, which was released from Mars Express on December 19th, just under a week prior to orbital insertion. The camera was switched off after the Beagle 2 release was complete, then brought back online in 2007.
One of the final images of Beagle 2, taken by VMC shortly after separation. Credit: ESA/Mars Express“(The) VMC camera was originally intended to take only a few snapshots of the lander release,” Alejandro Cardesín-Moinelo (ESA Mars Express Science Operations) told Universe Today. “The camera was then ‘forgotten’ for a few years until it was switched on again in 2007 as an engineering test. This showed a great value for public outreach and so it started to be operated regularly. In recent years, VMC images started getting more and more popular and raised the attention of the community due to its scientific potential.”
A Unique OrbitThe VMC was initially only tasked with taking supplementary images of Mars. A 2016 collaboration saw a push to upgrade the camera for scientific use. In 2018, it found a role monitoring the Martian weather. Mars Express is in a nearly polar orbit. Its distant 11,560 kilometer apoapsis vantage point along its 7.5 hour orbit is ideal for full disk observations.
The small VMC camera has a 40 by 30 degree wide field of view. This means it monitor full disk weather on Mars. Mars Express also offers the key advantage of a more flexible orbit versus other missions. The mission sees regions at different times and at illuminations.
IRIS-1 IC camera at the heart of VMC. Credit: ESA Mars Express as a Weather Satellite“VMC has proven to be a great asset in the global monitoring of the Martian atmosphere, complementing all other scientific instruments and providing very useful information on meteorological phenomena, mostly atmospheric aerosols, ice clouds and dust storms” says Cardesín-Moinelo. “Among the many scientific contributions, the main discovery was the striking Arsia Mons ‘elongated cloud’ spotted in 2018, a 1,500 kilometer cloud which had not been reported by any previous mission.”
Evolution of the cloud seen over Arsia Mons. Credit: ESA/Mars Express.The imaging workflow for VMC uses bias, flat and dark frames, not unlike what amateur astrophotographers use to process images. VMC is similar to old turn-of-the-century webcams, and produces small images that are easy to transmit back to Earth.
This also allows the VMC to carry out serious science. The instrument is calibrated for full disk photometry, useful for tracking weather and changes on Mars. Though VMC has a limited dynamic range, running a variety of exposures allows for the HDR (High Dynamic Range) imaging needed to reveal elusive features. Smartphone cameras use this sort of ‘hack’ to tease out detail.
Evolution of a Mars Camera“VMC is similar to a ‘cheap’ standard cell-phone camera of the early 2000s, with less than 0.2 megapixels,” says Cardesín-Moinelo. “This cannot provide a huge level of detail, but is located in an ‘extraordinary place,’ flying around Mars. This allows us to retrieve tens of images of the full disk of Mars every day so we can monitor the atmospheric clouds and dust storms, which we could not do with any other instrument. This kind of ‘cheap’ wide camera has proven very useful, so we are now pushing to fly an up-to-date camera in future missions, with more resolution and better performance to improve the global monitoring of the planet.”
But VMC had other issues to overcome as well in order to provide crucial science data. First, Mars Express’s internal clock isn’t entirely accurate. Plus, engineers fixed VMC on the chassis of the spacecraft. This means it points where Mars Express points during operations. In addition to using star field shots to get a fix on the spacecraft’s position, the team uses transits of the moons Phobos and Deimos across the disk of Mars as a clock to calibrate images and verify timestamps.
A montage of VMC images. Credit: ESA.VMC isn’t alone in monitoring Martian weather. The United Arab Emirates’ Mars Hope also does full disk imaging and can help see what’s currently going on. These opposing view points are handy to have as dust storm season evolves. Other instruments such as JunoCam aboard NASA’s Juno mission in orbit around Jupiter are designed solely around a similar sort of public collaboration.
Small Cameras for Small MissionsFinally, these sorts of basic off-the-shelf cameras are becoming standard equipment on smallsats. Examples in planetary science include the Mars Cube One MarCO-A and B cubesats which hitched a ride with NASA’s Mars Insight lander which flew past Mars in 2018, the Minerva-II landers aboard the Hayabusa 2 asteroid mission, and the Italian Space Agency’s LICIACube mission which witnessed the DART impact into asteroid Dimorphos in 2022.
Certainly, this is a game-changer for Martian weather predictions. It’s fascinating to see the unique images of Mars provided by VMC, as a demonstration of how old hardware in space can find a new purpose.
The post How Scientists Repurposed a Camera on ESA’s Mars Express Mission appeared first on Universe Today.
Readers’ wildlife photos
Reader David Hughes sent some photos of Zambezi and the fabled Victoria Falls, which have always been on my bucket list. David’s comments are indented, and you can enlarge his photos by clicking on them.
In October this year I took part in a group tour to southern Africa, starting off in Zambia and then going overland through the national parks and wildlife reserves of northern Botswana. Our starting point was a couple of days based at a comfortable lodge on the northern (Zambian) shore of the Zambezi River, about 45 km upstream from the Victoria Falls. Our first taste of the African wild came with a couple of leisurely boat cruises along the Zambezi.
This photo shows a riverside landscape along the Zambian shore. The antelope grazing near the water are impala (Aepyceros melampus), the most common medium-sized herbivore across all the areas we visited:
As you might expect, there is an abundant and diverse community of fish-eating birds along the river. The group shown here includes black-headed heron (Ardea melanocephala), great egret (Ardea alba), African sacred ibis (Threskiornis aethiopicus) and white-breasted cormorant (Phalacocorax lucidus):
One of the benefits of exploring the river on a slow, quiet boat is that you can get much closer to birds and animals than you could on foot, or in a noisy motor vehicle. This is the African wattled lapwing (Vanellus senegallus):
Just to remind us that we were indeed in Africa, a basking Nile crocodile (Crocodylus niloticus):
The habitual companion of the crocodile throughout the inland waters of Africa, a trio of dozing hippos (Hippopotamus amphibius):
A river cruise is also a great way to see many of the land mammals as they come down to drink. This female greater kudu (Tragelaphus strepsiceros) is accompanied by a pair of oxpeckers, I think the yellow-billed oxpecker, Buphagus africanus:
A Nile monitor lizard (Varanus niloticus). This one was about a metre and a half long:
The river cruise also gave us our first view of African bush elephants (Loxodonta africana). The elephants here, with access to permanent water, have a much easier life than their cousins living in the drier areas we were shortly to visit:
After cruising the Zambezi, the next day was spent visiting the spectacular Victoria Falls (Mosi-oa-Tunya in the local vernacular). The Falls consist of a long, winding gorge with water cascades at particular points. These pictures were taken from the Zimbabwean side of the gorge, which is generally considered to give the better views. To get there from Zambia involves buying a temporary visa to cross the international border, then an additional fee to get into the park area (all payable in hard currency, of course), but it’s well worth it:
Another view of one of the cascades. October is late in the dry season, and the water volume is relatively low. During the wet season there’s much more water going over the edge but this throws up so much spray that it can be difficult to see the Falls in their true magnificence:
A final view of the Falls. Near the centre, some people are just visible at the top of the cliffs, giving a sense of scale:
There’s a pleasant walking trail which follows the line of the gorge, and some wildlife to be seen. This young male Cape bushbuck (Tragelaphus sylvaticus – although the taxonomy of these antelopes is disputed) was obviously used to people and quite happy to pose for photos next to the trail:
SpIRIT CubeSat Demonstrates a Operational Gamma and X-Ray Detector
CubeSats are becoming more and more capable, and it seems like every month, another CubeSat is launched doing something new and novel. So far, technology demonstration has been one of the primary goals of those missions, though the industry is moving into playing an active role in scientific discovery. However, there are still some hurdles to jump before CubeSats have as many scientific tools at their disposal as larger satellites. That is where the Space Industry Responsive Intelligent Thermal (SpIRIT) CubeSat, the first from the Univeristy of Melbourne’s Space Lab, hopes to make an impact. Late in 2023, it launched with a few novel systems to operate new scientific equipment, and its leaders published a paper a few months ago detailing the progress of its mission so far.
SpIRIT represents a first not only for the Melbourne Space Lab but also for Australia as a whole. Their space agency was first set up in 2018 and began funding the SpIRIT project in 2020, as the COVID pandemic started making joint development efforts difficult. To contribute to the nation’s overall learning of how to build and control CubeSat, as much equipment as possible was sourced directly from Australian companies, including an ion drive from Neumann Space and a solar panel platform from Inovor Technologies.
However, the most exciting part of the SpIRIT mission was the instruments explicitly designed for it. There were several interesting ones, including HERMES, an X-ray and gamma-ray detector; TheMIS, a thermal management system used to cool HERMES; LORIS, an edge computing system; and Mercury, for use in low-latency communications.
This video describes the importance of SpIRIT to the Australian space program.Credit – Australian Space Agency YouTube Channel
Each system is designed to address a specific development problem plaguing CubeSats more generally. They aren’t typically able to capture light in specific wavelengths, such as gamma waves, because the sensors for those wavelengths, which include infrared, require active cooling systems that are too bulky to fit into a CubeSat’s space constraints.
Additionally, the sheer amount of data collected by modern sensors would be overwhelming for the communication links available to standard CubeSats. A single sensor could produce as much as 100Gb of data per day, while a standard downlink channel would allow only 1Gb of data to be sent back to Earth. Combining “edge computing,” where preliminary data processing is done on the CubeSat, with a low-latency communication line is SpIRIT’s solution to that problem. However, TheMIS would also have to deal with the additional heat generated by inefficiencies in the processing unit.
Preliminary results of the project look good, with HERMES beginning complete observations in March and TheMIS successfully managing thermal loads automatically. LORIS has successfully captured some camera images and started performing image recognition algorithms. Mercury has been more of a struggle, with intermittent communication happening throughout the satellite’s lifetime. Since the whole project has primarily been considered a technology demonstration mission, those growing pains are understandable and don’t seem to affect the overall mission operation.
Members of the Spirit Team discuss the development of the project.Credit – ARES Unimelb YouTube Channel
In addition to technical derisking, many of the lessons the mission operators at the Melbourne Space Lab learned were about managing space projects more generally. Project management and personnel allocation might not be the most interesting topics, but they are necessary for completing a technical project like SpIRIT.
With over 2000 successful CubeSat launches, SpIRIT is another valuable industry contribution. As CubeSats become more widely used as scientific platforms, expect to see more and more efforts like SpIRIT reporting on their progress soon.
Learn More:
Trenti et al. – SpIRIT Mission: In-Orbit Results and Technology Demonstrations
UT – A Gamma Ray Burst Lasted So Long it Triggered a Satellite Twice
UT – A 2022 Gamma Ray Burst Was So Powerful, it was Detected by Spacecraft Across the Solar System
UT – What are CubeSats?
Lead Image:
Depiction of the SpIRIT CubeSat.
Credit – Trenti et al.
The post SpIRIT CubeSat Demonstrates a Operational Gamma and X-Ray Detector appeared first on Universe Today.
Sun-Like Stars Around Black Holes: What Gives?
Buried in the treasure trove of the Gaia catalog were two strange black hole systems. These were black holes orbiting sun-like stars, a situation that astronomers long thought impossible. Recently a team has proposed a mechanism for creating these kinds of oddballs.
The two black holes, dubbed BH1 and BH2, are each almost ten times the mass of the Sun. That’s not too unusual as black holes go, but what makes these systems strange is that they each have a companion star with roughly the same properties as the Sun. And those stars are orbiting on very wide orbits.
The problem with this setup is that typically sun-like stars don’t survive the transition of a companion turning into a black hole. The end of a giant star’s life is generally violent. When they die, they tend to either eject their smaller companion from the system completely, or just outright swallow them. Either way, we don’t expect small stars to orbit black holes.
But now researchers have a potential solution. They tracked the evolution of extremely massive stars, no smaller than 80 times the mass of the Sun. They found at the end of their lives they eject powerful winds that siphon off enormous amounts of material. This prevents the star from swelling so much that it just swallows its smaller companion. Eventually the star goes supernova and leaves behind a black hole.
Then the researchers studied just how common this kind of scenario is. They found many cases where a sun-like star with a wide enough orbit could survive this transition phase. The key is that the strong winds coming from the larger star have to be powerful enough to limit its late stage violence while still weak enough to not affect the smaller star. The researchers found that this was a surprisingly common scenario and could easily explain the existence of BH2 and BH2.
Based on these results the researchers believe that there might be hundreds of such systems in the Gaia data set that have yet to be discovered. It turns out that the universe is always surprising us and always much more clever than we could ever realize.
The post Sun-Like Stars Around Black Holes: What Gives? appeared first on Universe Today.
Celebrating the Standard Model: The Magic Angle
Particle physicists describe how elementary particles behave using a set of equations called their “Standard Model.” How did they become so confident that a set of math formulas, ones that can be compactly summarized on a coffee cup, can describe so much of nature?
My previous “Celebrations of the Standard Model” (you can find the full set here) have included the stories of how we know the strengths of the forces, the number of types (“flavors” and “colors”) and the electric charges of the quarks, and the structures of protons and neutrons, among others. Along the way I explained how W bosons, the electrically charged particles involved in the weak nuclear force, quickly decay (i.e. disintegrate into other particles). But I haven’t yet explained how their cousin, the electrically-neutral Z boson, decays. That story brings us to a central feature of the Standard Model.
Here’s the big picture. There’s a super-important number that plays a central role in the Standard Model. It’s a sort of angle (in a sense that will become clearer in Figs. 2 and 3 below), and is called θw or θweak. Through the action of the Higgs field on the particles, this one number determines many things, including
- the relative masses of the W and Z bosons
- the relative lifetimes of the W and Z bosons
- the relative probabilities for Z bosons to decay to one type of particle versus another
- the relative rates to produce different types of particles in scattering of electrons and positrons at very high energies
- the relative rates for processes involving scattering neutrinos off atoms at very low energies
- asymmetries in weak nuclear processes (ones that would be symmetric in corresponding electromagnetic processes)
and many others.
This is an enormously ambitious claim! When I began my graduate studies in 1988, we didn’t know if all these predictions would work out. But as the data from experiments came in during the 1990s and beyond, it became clear that every single one of them matched the data quite well. There were — and still are — no exceptions. And that’s why particle physicists became convinced that the Standard Model’s equations are by far the best they’ve ever found.
As an illustration, Fig. 1 shows, as a function of sin θw, the probabilities for Z bosons to decay to each type of particle and its anti-particle. Each individual probability is indicated by the size of the gap between one line and the line above. The total probability always adds up to 1, but the individual probabilities depend on the value of θw. (For instance, the width of the gap marked “muon” indicates the probability for a Z to decay to a muon and an anti-muon; it is about 5% at sin θw = 0, about 3% at sin θw = 1/2, and over 15% at sin θw = 1.)
Figure 1: In the Standard Model, once sin θw is known, the probabilities for a Z boson to decay to other particles and their anti-particles are predicted by the sizes of the gaps at that value of sin θw. Other measurements (see Fig. 3) imply sin θw is approximately 1/2 , and thus predict the Z decay probabilities to be those found in the green window. As Fig. 5 will show, data agrees with these predictions.
As we’ll see in Fig. 3, the W and Z boson masses imply (if the Standard Model is valid) that sin θw is about 1/2. Using that measurement, we can then predict that all the various decay probabilities should be given within the green rectangle (if the Standard Model is valid). These predictions, made in the mid-1980s, proved correct in the 1990s; see Fig. 5 below.
This is what I’ll sketch in today’s post. In future posts I’ll go further, showing how this works with high precision.
The Most Important Angle in Particle PhysicsAngles are a common feature of geometry and nature: 90 degree angles of right-angle triangles, the 60 degree angles of equilateral triangles, the 104.5 degree angle between the two hydrogen-oxygen bonds in a water molecule, and so many more. But some angles, more abstract, turn out to be even more important. Today I’ll tell you about θw , which is a shade less than 30 degrees (π/6 radians).
Note: This angle is often called “the Weinberg angle”, based on Steven Weinberg’s 1967 version of the Standard Model, but it should be called the “weak-mixing angle”, as it was first introduced seven years earlier by Sheldon Glashow, before the idea of the Higgs field.
This is the angle that lies at the heart of the Standard Model: the smallest angle of the right-angle triangle shown in Fig. 2. Two of its sides represent the strengths g1 and g2 of two of nature’s elementary forces: the weak-hypercharge force and the weak-isospin force. According to the Standard Model, the machinations of the Higgs field transform them into more familar forces: the electromagnetic force and the weak nuclear force. (The Standard Model is often charaterized by the code SU(3)xSU(2)xU(1); weak-isospin and weak-hypercharge are the SU(2) and U(1) parts, while SU(3) gives us the strong nuclear force).
Figure 2: The electroweak right-triangle, showing the angle θw. The lengths of two of its sides are proprtional to the strengths g1 and g2 of the “U(1)” weak-hypercharge force and the “SU(2)” weak-isospin force.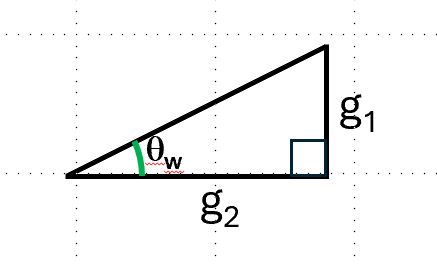
To keep things especially simple today, let’s just say θw = 30 degrees, so that sin θw = 1/2. In a later post, we’ll see the angle is closer to 28.7 degrees, and this makes a difference when we’re being precise.
The Magic Angle and the W and Z BosonsThe Higgs field gives masses to the W and Z bosons, and the structure of the Standard Model predicts a very simple relation, given by the electroweak triangle as shown at the top of Fig. 3:
This has the consequence shown at the top of Fig. 3, rewritten as a prediction
If sin θw = 1/2 , this quantity is predicted to be 1/4 = 0.250. Measurements (mW = 80.4 GeV/c2 and mZ = 91.2 GeV/c2) show it to be 0.223. Agreement isn’t perfect, indicating that the angle isn’t exactly 30 degrees. But it is close enough for today’s post.
Where does this formula for the W and Z masses come from? Click here for details:Central to the Standard Model is the so-called “Higgs field”, which has been switched on since very early in the Big Bang. The Higgs field is responsible for the masses of all the known elementary particles, but in general, though we understand why the masses aren’t zero, we can’t predict their values. However, there’s one interesting exception. The ratio of the W and Z bosons’ masses is predicted.
Before the Higgs field switched on, here’s how the weak-isospin and weak-hypercharge forces were organized: there were
- 3 weak isospin fields, called W+, W– and W0, whose particles (of the same names) had zero rest mass
- 1 weak-hypercharge field, usually called, X, whose particle (of the same name) had zero rest mass
After the Higgs field switched on by an amount v, however, these four fields were reorganized, leaving
- One, called the electromagnetic field, with particles called “photons” with zero rest mass.
- One, called Z0 or just Z, now has particles (of the same names) with rest mass mZ
- Two, still called W+ and W– , have particles (of the same names) with rest mass mW
Central to this story is θw. In particular, the relationship between the photon and Z and the original W0 and X involves this angle. The picture below depicts this relation, given also as an equation
Figure 3: A photon is mostly an X with a small amount of W0, while a Z is mostly a W0 with a small amount of X. The proportions are determined by θw .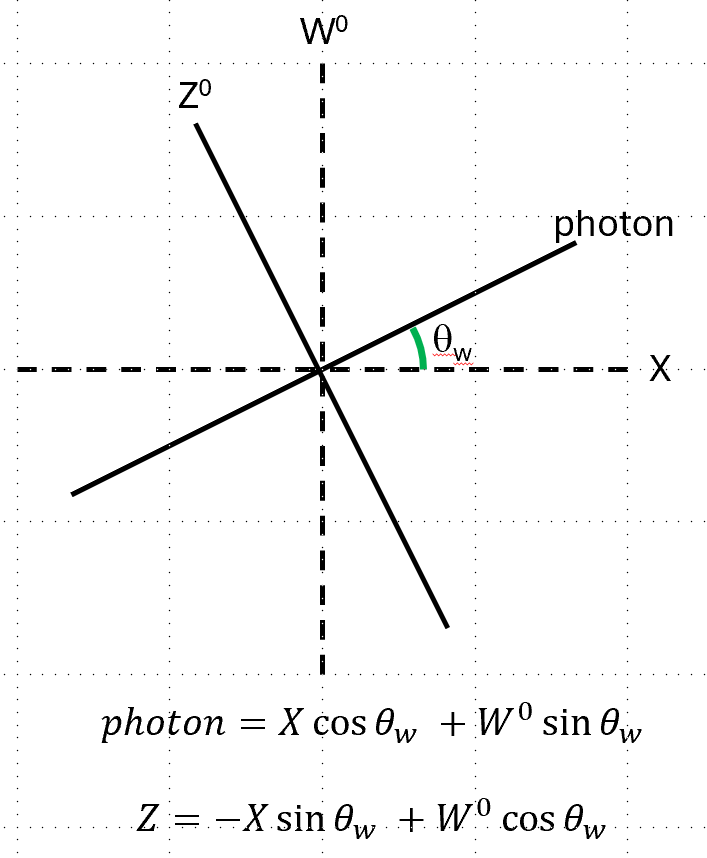
The W+ and W– bosons get their masses through their interaction, via the weak-isospin force, with the Higgs field. The Z boson gets its mass in a similar way, but because the Z is a mixture of W0 and X, both the weak-isospin and weak-hypercharge forces play a role. And thus mZ depends both on g1 and g2, while mW depends only on g2. Thus
where v is the “value” or strength of the switched-on Higgs field, and in the last step I have used the electroweak triangle of Fig. 2.
Figure 3: Predictions (*before accounting for small quantum corrections) in the Standard Model with sin θw = 1/2, compared with experiments. (Top) A simple prediction for the ratio of W and Z boson masses agrees quite well with experiment. (Bottom) The prediction for the ratio of W and Z boson lifetimes also agrees very well with experiment.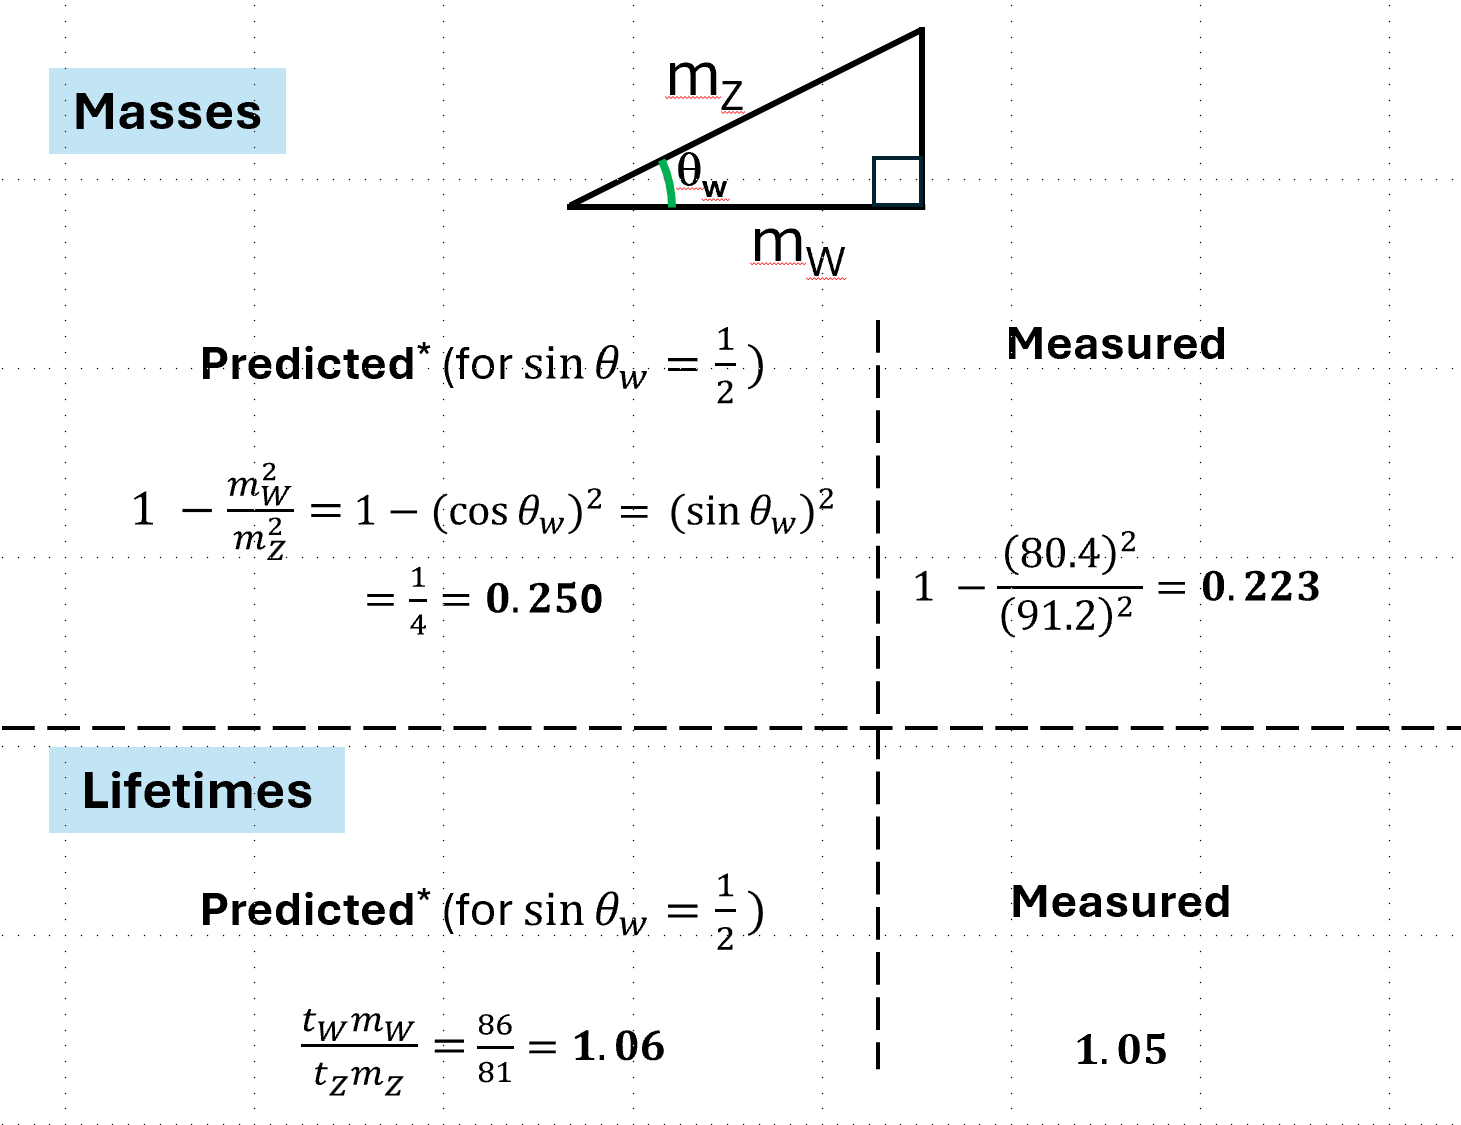
A slightly more complex relation relates the W boson’s lifetime tW and the Z boson’s lifetime tZ (this is the average time between when the particle is created and when it decays.) This is shown at the bottom of Fig. 3.
This is a slightly odd-looking formula; while 81 = 92 is a simple number, 86 is a weird one. Where does it come from? We’ll see in just a moment. In any case, as seen in Fig. 3, agreement between theoretical prediction and experiment is excellent.
If the Standard Model were wrong, there would be absolutely no reason for these two predictions to be even close. So this is a step in the right direction. But it is hardly the only one. Let’s check the detailed predictions in Figure 1.
W and Z Decay ProbabilitiesHere’s what the Standard Model has to say about how W and Z bosons can decay.
W DecaysIn this earlier post, I explained that W– bosons can decay (oversimplifying slightly) in five ways:
- to an electron and a corresponding anti-neutrino
- to a muon and a corresponding anti-neutrino
- to a tau and a corresponding anti-neutrino
- to a down quark and an up anti-quark
- to a strange quark and a charm anti-quark
(A decay to a bottom quark and top anti-quark is forbidden by the rule of decreasing rest mass; the top quark’s rest mass is larger than the W’s, so no such decay can occur.)
These modes have simple probabilities, according to the Standard Model, and they don’t depend on sin θw (except through small quantum corrections which we’re ignoring here). The first three have probability 1/9. Moreover, remembering each quark comes in three varieties (called “colors”), each color of quark also occurs with probability 1/9. Altogether the predictions for the probabilities are as shown in Fig. 4, along with measurements, which agree well with the predictions. When quantum corrections (such as those discussed in this post, around its own Fig. 4) are included, agreement is much better; but that’s beyond today’s scope.
Figure 4: The W boson decay probabilities as predicted (*before accounting for small quantum corrections) by the Standard Model; these are independent of sin θw . The predictions agree well with experiment.
Because the W+ and W- are each others’ anti-particles, W+ decay probabilities are the same as those for W–, except with all particles switched with their anti-particles.
Z DecaysUnlike W decays, Z decays are complicated and depend on sin θw. If sin θw = 1/2, the Standard Model predicts that the probability for a Z boson to decay to a particle/anti-particle pair, where the particle has electric charge Q and weak-isospin-component T = +1 or -1 [technically, isospin’s third component, times 2], is proportional to
- 2 (Q/2-T)2 + 2(Q/2)2 = 2+2TQ+Q^2
where I used T2 = 1 in the final expression. The fact that this answer is built from a sum of two different terms, only one of which involves T (weak-isospin), is a sign of the Higgs field’s effects, which typically marry two different types of fields in the Standard Model, only one of which has weak-isospin, to create the more familiar ones.
This implies the relative decay probabilities (remembering quarks come in three “colors”) are
- For electrons, muons and taus (Q=-1, T=-1): 1
- For each of the three neutrinos (Q=0, T=1): 2
- For down-type quarks (Q=-1/3,T=-1) : 13/9 * 3 = 13/3
- For up-type quarks (Q=2/3,T=1): 10/9 * 3 = 10/3
These are shown at left in Fig. 5.
Figure 5: The Z boson decay probabilities as predicted (*before accounting for small quantum corrections) by the Standard Model at sin θw = 1/2 (see Fig. 1), and compared to experiment. The three neutrino decays cannot be measured separately, so only their sum is shown. Of the quarks, only the bottom and charm decays can be separately measured, so the others are greyed out. But the total decay to quarks can also be measured, meaning three of the five quark predictions can be checked directly.
The sum of all those numbers (remembering that there are three down-type quarks and three up-type quarks, but again top quarks can’t appear due to the rule of decreasing rest mass) is:
- 1 + 1 + 1 + 2 + 2 + 2 + 13/3 + 13/3 + 13/3 + 10/3 + 10/3 = 86/3.
And that’s where the 86 seen in the lifetime ratio (Fig. 3) comes from.
To get predictions for the actual decay probabilities (rather than just the relative probabilities), we should divide each relative probability by 86/3, so that the sum of all the probabilities together is 1. This gives us
- For electrons, muons and taus (Q=-1, I=-1): 3/86
- For each of the three neutrinos (Q=0, I=1): 6/86
- For down-type quarks (Q=-1/3,I=-1) : 13/86
- For up-type quarks (Q=2/3,I=1): 10/86
as shown on the right-hand side of Fig. 5; these are the same as those of Fig. 1 at sin θw = 1/2. Measured values are also shown in Fig. 5 for electrons, muons, taus, the combination of all three neutrinos, the bottom quark, the charm quark, and (implicitly) the sum of all five quarks. Again, they agree well with the predictions.
This is already pretty impressive. The Standard Model and its Higgs field predict that just a single angle links a mass ratio, a lifetime ratio, and the decay probabilities of the Z boson. If the Standard Model were significantly off base, some or all of the predictions would fail badly.
However, this is only the beginning. So if you’re not yet convinced, consider reading the bonus section below, which gives four additional classes of examples, or stay tune for the next post in this series, where we’ll look at how things improve with a more precise value of sin θw.
Bonus: Other Predictions of the Standard ModelMany other processes involving the weak nuclear force depend in some way on sin θw. Here are a few examples.
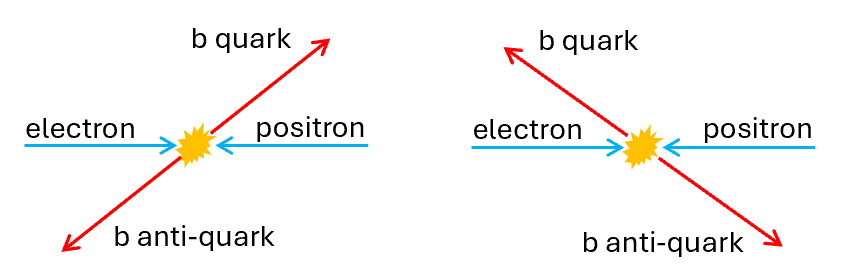
High-Energy Electron-Positron Collisions (click for details)In this post I discussed the ratio of the rates for two important processes in collisions of electrons and positrons:
- electron + positron ⟶ any quark + its anti-quark
- electron + positron ⟶ muon + anti-muon
This ratio is simple at low energy (E << mZ c2), because it involves mainly electromagnetic effects, and thus depends only on the electric charges of the particles that can be produced.
Figure 6: The ratio of the rates for quark/anti-quark production versus muon/anti-muon production in high-energy electron-positron scattering depends on sin θw.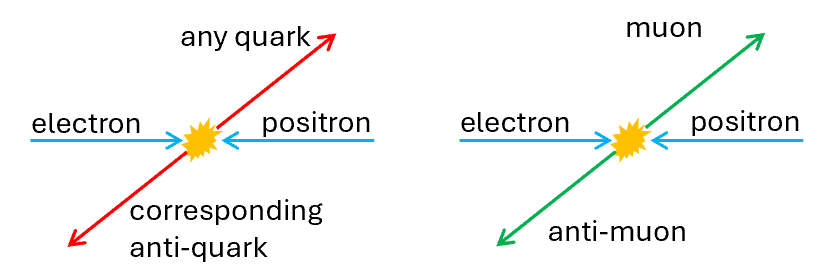
But at high energy (E >> mZ c2) , the prediction changes, because both electromagnetic and weak nuclear forces play a role. In fact, they “interfere”, meaning that one must combine their effects in a quantum way before calculating probabilities.
[What this cryptic quantum verbiage really means is this. At low energy, if Sf is the complex number representing the effect of the photon field on this process, then the rate for the process is |Sf|2. But here we have to include both Sf and SZ, where the latter is the effect of the Z field. The total rate is not |Sf|2 + |SZ|2 , a sum of two separate probabilities. Instead it is |Sf+SZ|2 , which could be larger or smaller than |Sf|2 + |SZ|2 — a sign of interference.]
In the Standard Model, the answer depends on sin θw. The LEP 2 collider measured this ratio at energies up to 209 GeV, well above mZ c2. If we assume sin θw is approximately 1/2, data agrees with predictions. [In fact, the ratio can be calculated as a function of energy, and thus made more precise; data agrees with these more precise predictions, too.]
Low-Energy Neutrino-Nucleus Collisions (click for details)When electrons scatter off protons and neutrons, they do so via the electromagnetic force. For electron-proton collisions, this is not surprising, since both protons and electrons carry electric charge. But it’s also true for neutrons, because even though the neutron is electrically neutral, the quarks inside it are not.
By contrast, neutrinos are electrically neutral, and so they will only scatter off protons and neutrons (and their quarks) through the weak nuclear force. More precisely, they do so through the W and Z fields (via so-called “virtual W and Z particles” [which aren’t particles.]) Oversimplifying, if one can
- obtain beams of muon neutrinos, and
- scatter them off deuterons (nuclei of heavy hydrogen, which have one proton and one neutron), or off something that similarly has equal numbers of protons and neutrons,
then simple predictions can be made for the two processes shown at the top of Fig. 7, in which the nucleus shatters (turning into multiple “hadrons” [particles made from quarks, antiquarks and gluons]) and either a neutrino or a muon emerges from the collision. (The latter can be directly observed; the former can be inferred from the non-appearance of any muon.) Analogous predictions can be made for the anti-neutrino beams, as shown at the bottom of Fig. 7.
Figure 7: The ratios of the rates for these four neutrino/deuteron or anti-neutrino/deuteron scattering processes depend only on sin θw in the Standard Model.
The ratios of these four processes are predicted to depend, in a certain approximation, only on sin θw. Data agrees with these predictions for sin θw approximately 1/2.
More complex and detailed predictions are also possible, and these work too.
Asymmetries in Electron-Positron Collisions (click for details)There are a number of asymmetric effects that come from the fact that the weak nuclear force is
- not “parity-invariant”, (i.e. not the same when viewed in a mirror), and
- not “charge-conjugation invariant” (i.e. not the same when all electric charges are flipped)
though it is almost symmetric under doing both, i.e. putting the world in a mirror and flipping electric charge. No such asymmetries are seen in electromagnetism, which is symmetric under both parity and charge-conjugation separately. But when the weak interactions play a role, asymmetries appear, and they all depend, yet again, on sin θw.
Two classes of asymmetries of great interest are:
- “Left-Right Asymmetry” (Fig. 8): The rate for electron-positron collisions to make Z bosons in collisions with positrons depends on which way the electrons are “spinning” (i.e. whether they carry angular momentum along or opposite to their direction of motion.)
- “Forward-Backward Asymmetry” (Fig. 9): The rate for electron-positron collisions to make particle-antiparticle pairs depends on whether the particles are moving roughly in the same direction as the electrons or in the same direction as the positrons.
As with the high-energy electron-positron scattering discussed above, interference between effects of the electromagnetic and Z fields, and the Z boson’s mass, causes these asymmetries to change with energy. They are particularly simple, though, both when E = mZ c2 and when E >> mZ c2.
A number of these asymmetries are measurable. Measurements of the left-right asymmetry was made at the Stanford Linear Accelerator Center (SLAC) at their Linear Collider (SLC), while I was a graduate student there. Meanwhile, measurements of the forward-backward asymmetries were made at LEP and LEP 2. All of these measurements agreed well with the Standard Model’s predictions.
A Host of Processes at the Large Hadron Collider (click for details)Fig. 10 shows predictions (gray bands) for total rates of over seventy processes in the proton-proton collisions at the Large Hadron Collider. Also shown are measurements (colored squares) made at the CMS experiment . (A similar plot is available from the ATLAS experiment.) Many of these predictions, which are complicated as they must account for the proton’s internal structure, depend on sin θw .
Figure 10: Rates for the production of various particles at the Large Hadron Collider, as measured by the CMS detector collaboration. Grey bands are theoretical predictions; color bands are experimental measurements, with experimental uncertainties shown as vertical bars; colored bars with hatching above are upper limits for cases where the process has not yet been observed. (In many cases, agreement is so close that the grey bands are hard to see.)
While minor discrepancies between data and theory appear, they are of the sort that one would expect in a large number of experimental measurements. Despite the rates varying by more than a billion from most common to least common, there is not a single major discrepancy between prediction and data.
Many more measurements than just these seventy are performed at the Large Hadron Collider, not least because there are many more details in a process than just its total rate.
A FortressWhat I’ve shown you today is just a first step, and one can do better. When we look closely, especially at certain asymmetries described in the bonus section, we see that sin θw = 1/2 (i.e. θw = 30 degrees) isn’t a good enough approximation. (In particular, if sin θw were exactly 1/2, then the left-right asymmetry in Z production would be zero, and the forward-backward asymmetry for muon and tau production would also be zero. That rough prediction isn’t true; the asymmetries are small, only about 15%, but they are clearly not zero.)
So to really be convinced of the Standard Model’s validity, we need to be more precise about what sin θw is. That’s what we’ll do next time.
Nevertheless, you can already see that the Standard Model, with its Higgs field and its special triangle, works exceedingly well in predicting how particles behave in a wide range of circumstances. Over the past few decades, as it has passed one experimental test after another, it has become a fortress, extremely difficult to shake and virtually impossible to imagine tearing down. We know it can’t be the full story because there are so many questions it doesn’t answer or address. Someday it will fail, or at least require additions. But within its sphere of influence, it rules more powerfully than any theoretical idea known to our species.
Your Brain In Space
Amid all the shocking and depressing news regarding the future of American healthcare and medicine, at least over the next four years, I thought I would tackle something a bit lighter today. What happens to the brains of astronauts aboard the ISS? Space medicine is a field of study, if fairly niche, and will likely have increasing implications as humanity increases its […]
The post Your Brain In Space first appeared on Science-Based Medicine.